Cartography with the NetworkX library
jeu. 17 janvier 2019 by Martin DeudonNetworkx is a Python package for the creation, manipulation, and study of the structure, dynamics, and functions of complex networks.
Tutorial on Datacamp : network-analysis-in-python-part-1
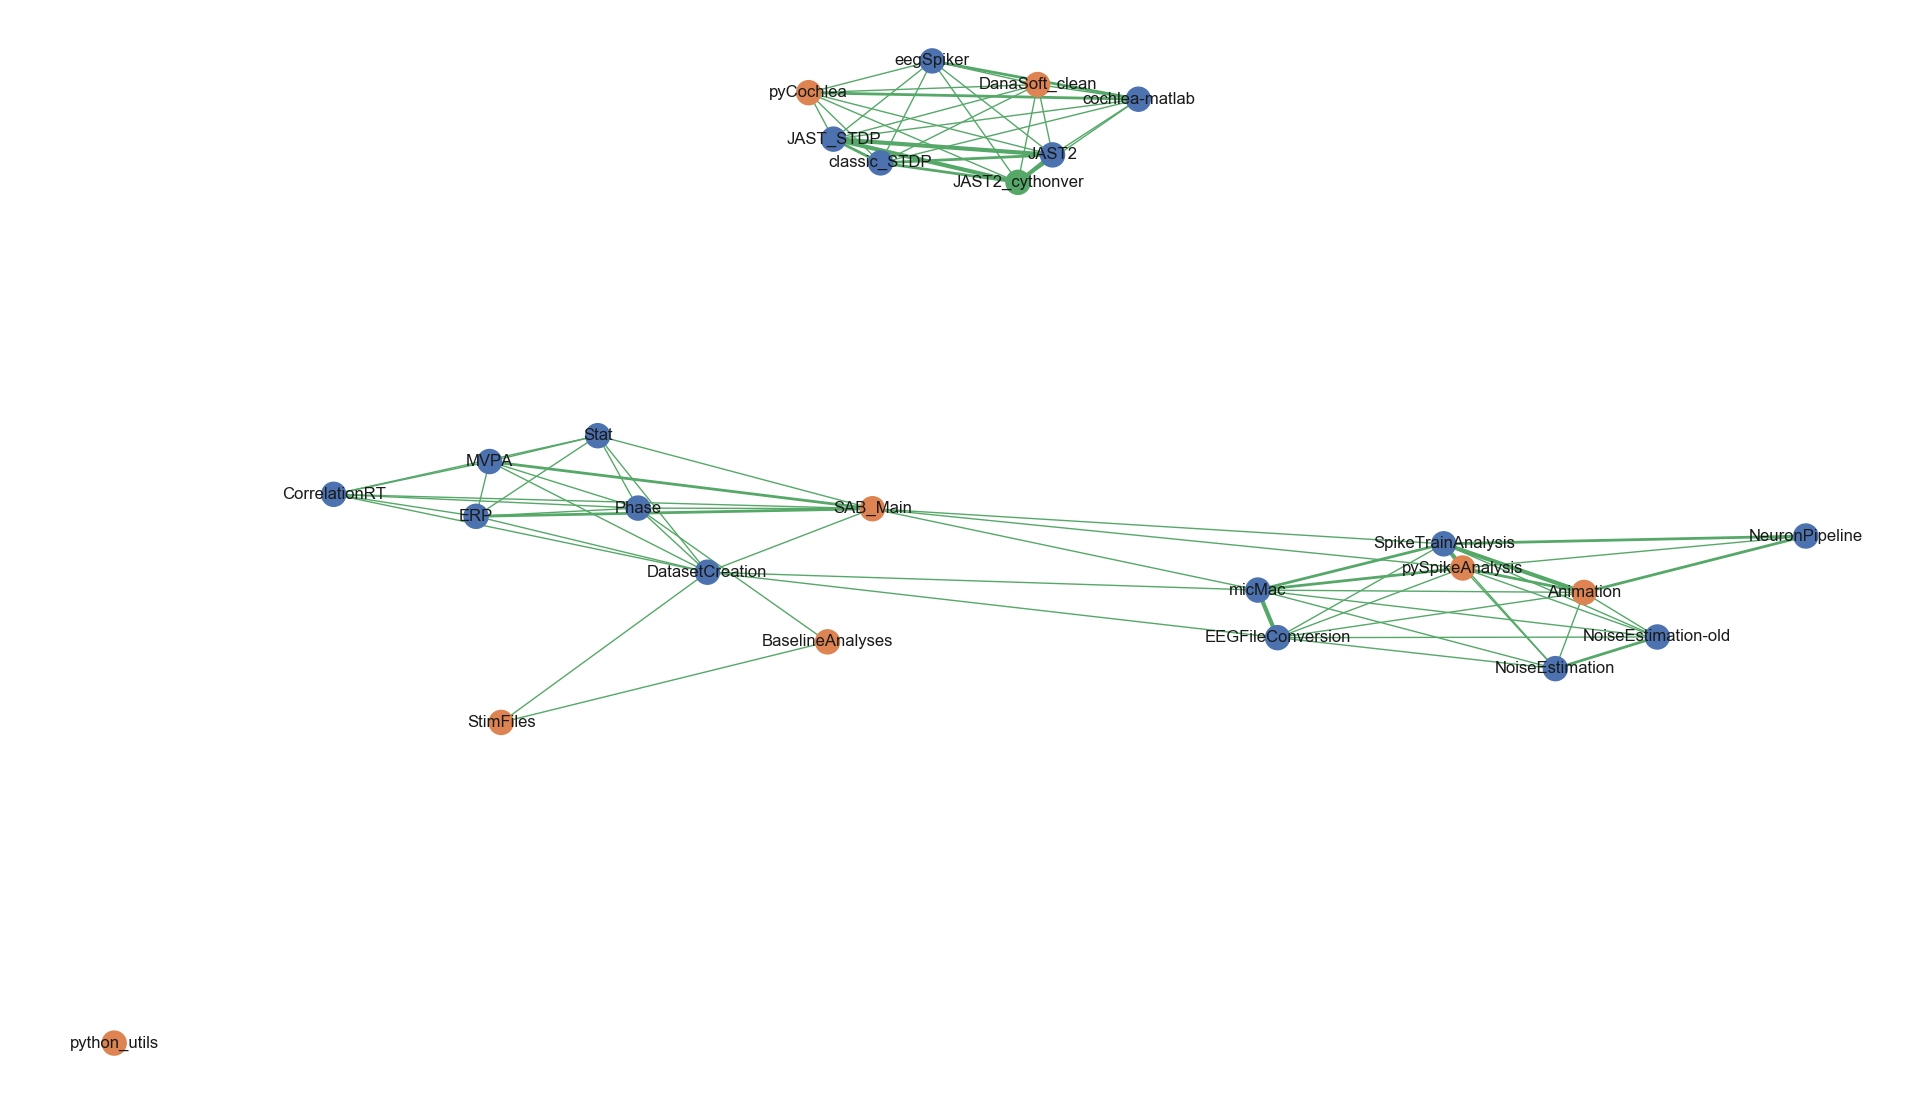
The following image was generated with networkx. It shows a map of the different scripts in both Python and Matlab: The projects sharing keywords between one another are grouped together.
It was generated with the following code :
import matplotlib
matplotlib.use('TkAgg')
import pandas as pd
import numpy as np
import networkx as nx
import seaborn as sns
sns.set()


names = ['micMac', 'EEGFileConversion', 'NoiseEstimation-old', 'NeuronPipeline', 'DatasetCreation', 'CorrelationRT',
         'ERP', 'MVPA', 'Stat', 'Phase', 'SAB_Main', 'NoiseEstimation', 'SpikeTrainAnalysis', 'Animation',
         'pySpikeAnalysis', 'BaselineAnalyses', 'StimFiles', 'DanaSoft_clean', 'cochlea-matlab', 'eegSpiker',
         'pyCochlea', 'JAST_STDP', 'JAST2', 'classic_STDP', 'JAST2_cythonver', 'python_utils', 'Interactive-Viz']
language = ['Matlab']*10+['Python']+['Matlab']*2+['Python']*5+['Matlab']*2+['Python']+['Matlab']*3+['Cython']+2*['Python']
state = [3, 2, -1, -2, 1, -2, 1, 1, 1, 0, 2, -1, -2, -1, 2, 1, 2, 3, 0, -3, 1, 1, 0, -2, 2, 1, -1]
keywords = [['Viz', 'EpiFar', 'micro', 'Macro'], ['File-conv', 'EpiFar', 'micro', 'Macro'], ['Noise', 'old', 'micro'],
            ['Neuron', 'Spike-Sorting'],
            ['SAB', 'Macro', 'Dataset-Creation'], ['SAB', 'Correlation'], ['SAB', 'ERPs'],
            ['SAB', 'MVPA'], ['SAB', 'Stat'], ['SAB', 'Phase'], ['SAB', 'ERPs', 'MVPA', 'Viz'],
            ['Noise', 'micro'], ['Spike-Sorting', 'Neuron', 'Viz', 'micro'],
            ['Spike-Sorting', 'Neuron', 'Animation', 'micro'], ['Spike-Sorting', 'Viz', 'micro'],
            ['Stimic', 'Phase', 'Freq-Analysis'], ['Stimic', 'Dataset-Creation'],
            ['M4', 'Soft. Danaé'], ['M4', 'Cochlea', 'Spike'], ['M4', 'Spike'], ['M4', 'Cochlea'],
            ['M4', 'STDP', 'JAST'], ['M4', 'STDP', 'JAST'], ['M4', 'STDP'], ['M4', 'STDP', 'JAST'],
            ['utils'], ['Viz', 'Interactive'],
            ]

df = pd.DataFrame({'name': names, 'language': language, 'Advancement': state, 'keywords': keywords})
entrie_names = df.name
n_entries = len(df)

G = nx.Graph()
G.add_nodes_from(df['name'])
# Add an edge between node a and b if a and b share a keywork
for i, key_a in enumerate(df['keywords']):
    for j, key_b in enumerate(df['keywords']):
        if i == j:
            continue
        n_shared_keys = len(set(key_a).intersection(set(key_b)))
        if n_shared_keys > 0:
            G.add_edge(entrie_names[i], entrie_names[j], weight=n_shared_keys)

unique_languages = df.language.unique()
colors = sns.color_palette(n_colors=unique_languages.size)
node_color_dict = dict(zip(unique_languages, colors))
node_color = [node_color_dict[lan] for lan in df.language]

# pos = nx.circular_layout(G)
weights = [G[u][v]['weight'] for u, v in G.edges()]

pos = nx.spring_layout(G, k=0.15, iterations=10)

nx.draw(G, pos=pos, node_color=node_color, with_labels=True, width=weights, edge_color='g')