Jupyter Notebook and Jupyter Lab
jeu. 10 janvier 2019 by Martin DeudonProject Jupyter
Project Jupyter has developped the Jupyter Notebook, an open-source web application that allows you to create and share documents that contain live code, equations, visualizations and narrative text.
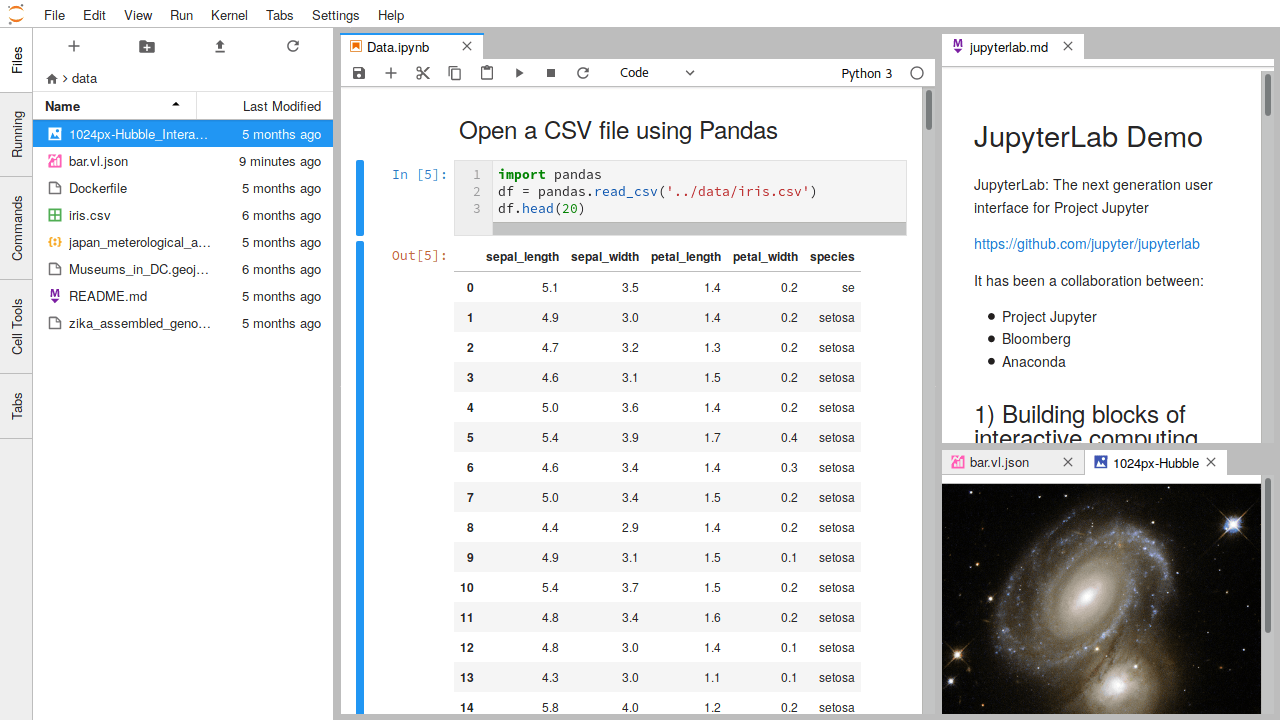
JupyterLab is a web-based user interface for Project Jupyter. It enables you to work with Jupyter notebooks, editors, terminals, in a web-based IDE.
Jupyter notebook example
You can visualize notebooks in the following site https://nbviewer.jupyter.org/. The other solution is to install jupyter notebooks. It will then run in your web browser. This solution is better as it will allow you to modify and run the code.
Here is an static example of a jupyter notebook :
In [2]:
import altair as alt
from vega_datasets import data
In [2]:
# Uncomment/run this line to enable Altair in the classic notebook (not JupyterLab)
alt.renderers.enable('notebook')
In [6]:
iris = data.iris()
iris.head()
Out[6]:
In [7]:
alt.Chart(iris).mark_square().encode(
    x='petalLength',
    y='petalWidth',
    color='species'
)
Out[7]:

First we’ll create an interval selection using the selection_interval() function:
In [8]:
brush = alt.selection_interval() # selection of type "interval"
In [11]:
alt.Chart(iris).mark_square().encode(
    x='petalLength',
    y='petalWidth',
    color=alt.condition(brush, 'species:N', alt.value('lightgray'))
).properties(
    selection=brush
)
Out[11]:
In [17]:
brush = alt.selection_interval(encodings=['x'])  # selection of type "interval"
chart = alt.Chart(iris).mark_square().encode(
    y='petalWidth',
    color=alt.condition(brush, 'species:N', alt.value('lightgray'))
).properties(
    selection=brush
)
In [18]:
chart.encode(x='petalLength') | chart.encode(x='sepalLength')
Out[18]:
