Stimic - Stimulation Detection Algorithm
jeu. 08 novembre 2018 by Martin DeudonDetection Algorithm Details
1 Hz Stimulation
For 1Hz stimulation we count the number of peaks if the threshold signal in the window [-0.1s, 10.1s] around each time of threshold crossing. If the number of peaks if equal to 10 more or less, the event is considered a 1Hz stimulation.
For each channel :
- Threshold signal (3150 uV and -3150 uV)
- Delete event if the previous one occured closely (less than 4s ago)
- Count the number of peaks in the time interval [-0.1s, 10.1s] on the thresholded signal, 0 being the time of threshold crossing
- Delete peak if the previous one occured less than 0.7s ago
- If the number of peaks is in the interval [8, 12], count the event as a 1Hz stimulation
1Hz < f < 50Hz Stimulation
For stimulation frequencies between 1Hz and 50Hz, the first steps are the same as for the 1Hz stimulation and we compute the Power Spectral Density of the [-0.1, 10.1s] interval around the threshold crossing time.
For each channel
- Threshold signal (3150 uV and -3150 uV)
- Delete event if the previous one occured closely (less than 4s ago)
- Compute the Power Spectral Density on the interval [-0.1, 10.1s] using Welch method (hanning window of 1/5 of the length of the window ~= 2s - overlap : 50% overlap between windows, nfft : 16384). Select the frequencies between 0.3 and 100 Hz.
- Compute the PSD baseline : Divide the signal in k segments of N samples, then take the minimum value from each segment (6Hz windows). Low-pass the resulting signal (wn = 0.01, filt_order=5)
- Remove the PSD baseline to get a corrected PSD
- For each frequency of stimulation (must be specified at the beginning), if the corrected PSD at the stimulation frequency is superior at 15 dB, count this event as a stimulation
Note : 1Hz stimulations could be detected with this algorithm but the method described above seemed more robust.
50Hz Stimulation
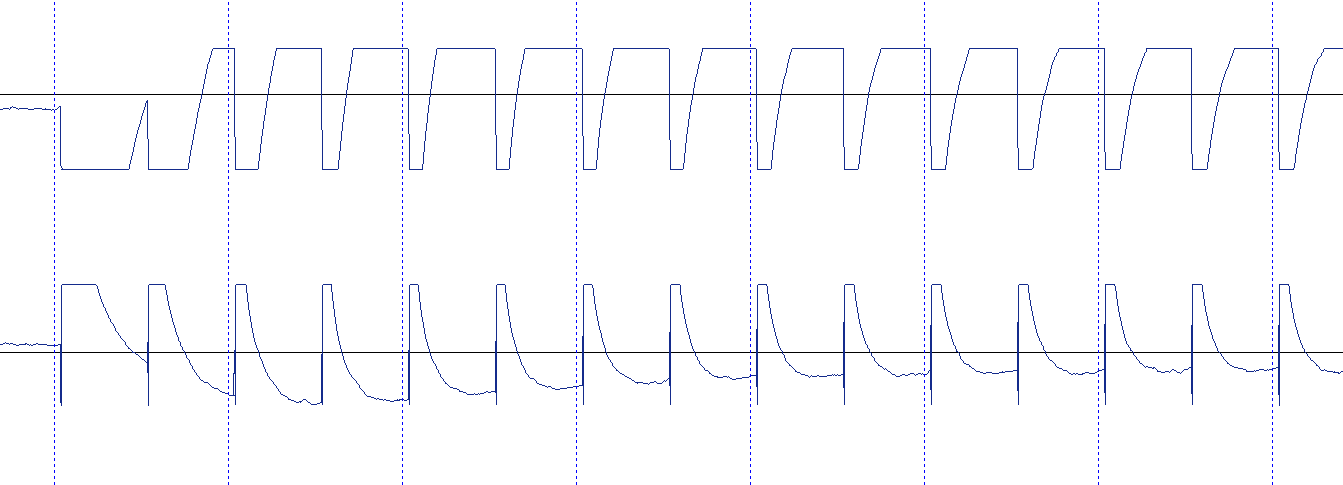
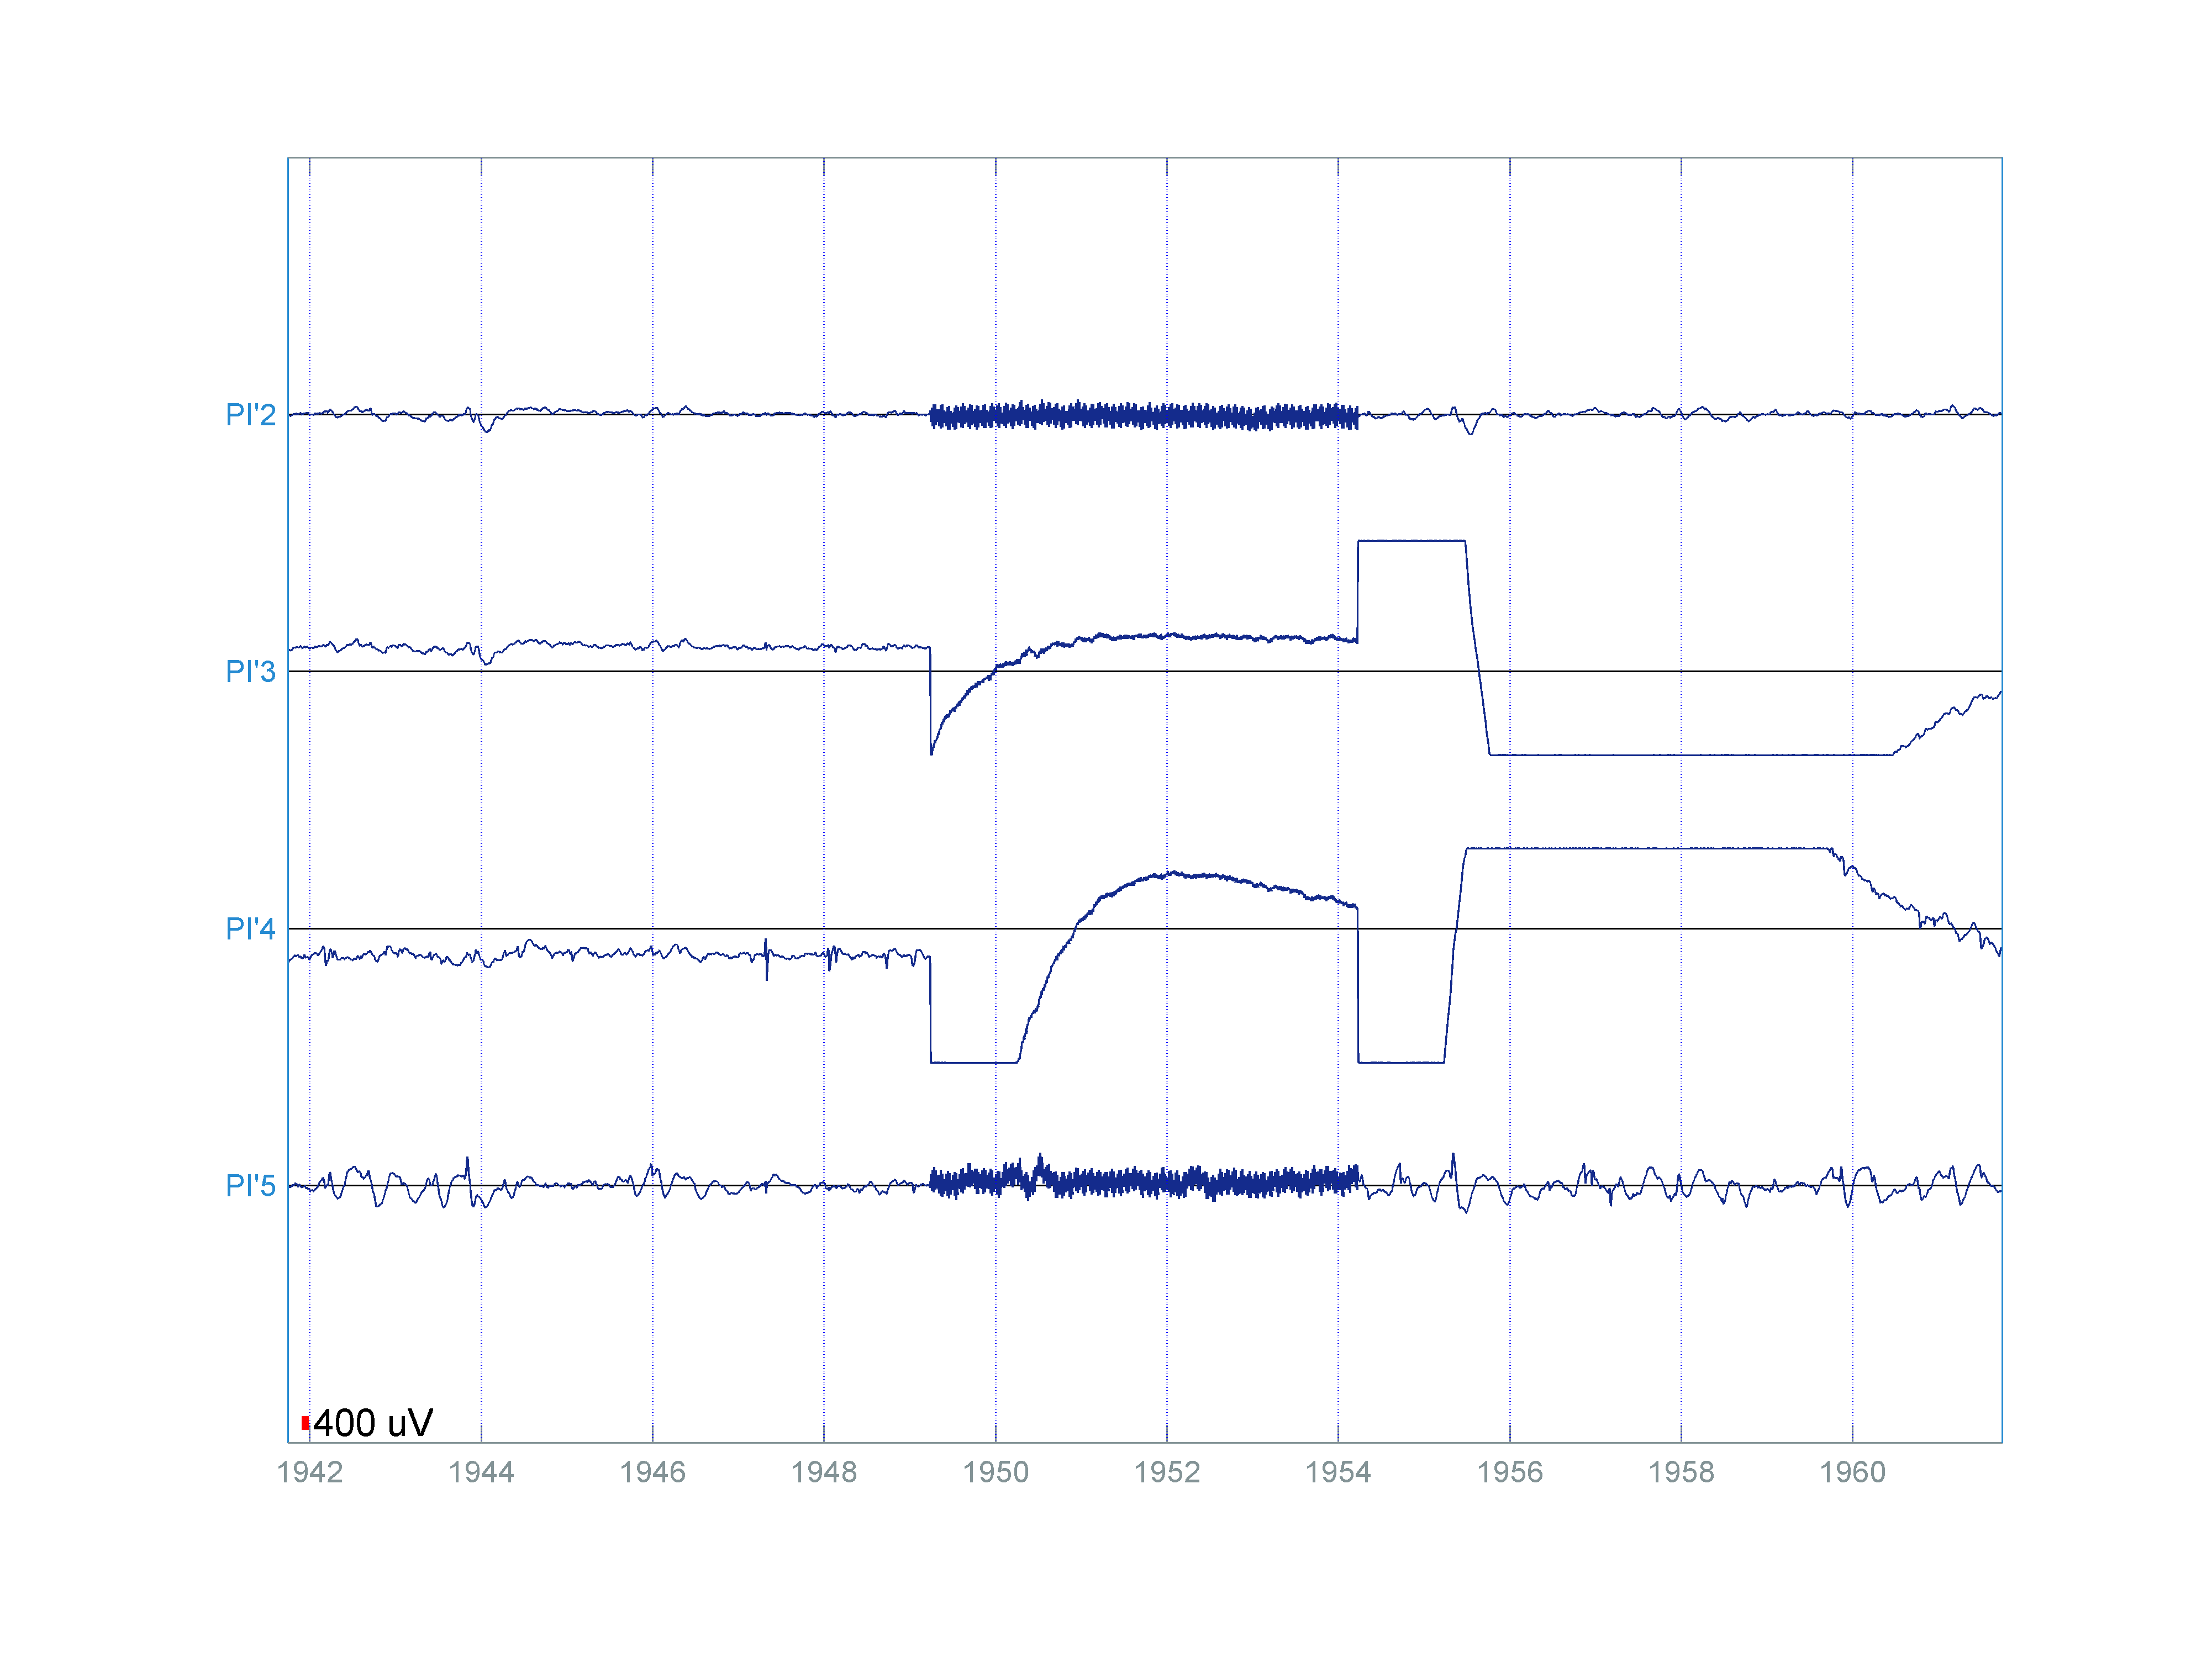
The stimulation artifact for 50Hz stimulation is not a 50Hz signal, we observe on the stimulation channel a saturation period followed by a slow wave (see figure).
For detecting this artifact, we first compute an average artifact smoothed waveform :
- We manually set the onset of 50Hz stimulation period for 13 stimulations (giving 26 waveforms on monopolar data).
- Smooth each waveform with a 6th order butterworth low pass filter, cutoff frequency of 1Hz (forward, backward filtering)
- If the first point of each smoothed waveform is negative, inverse the waveform.
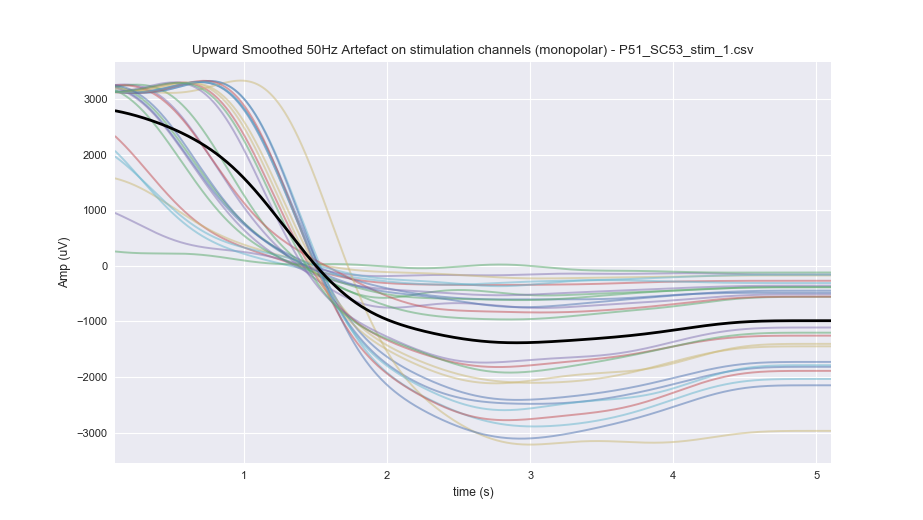
We can notive that the time of zero-crossing in the smoothed waveforms occured in a small time window [1.3, 1.8s]
Moreover waveforms are highly correlated between each other :
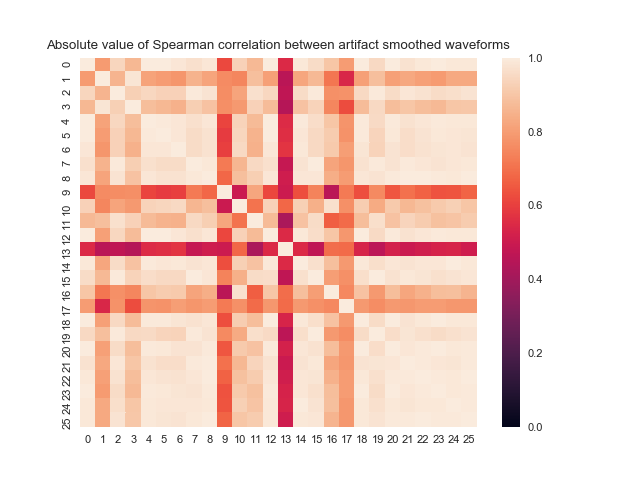
Once we have this mean 50Hz artifact pattern, we can use it to compare the waveform at each threshold crossing time with this pattern using Spearman correlation.
- Threshold signal (3150 uV and -3150 uV)
- Delete event if the previous one occured closely (less than 4s ago)
- Remove the first 0.1s of the waveform to remove the first peak : select the interval [+0.1, 5s]
- Low pass the filter (6th order, low pass Butterworth filter, 1Hz cutoff frequency).
- Compare the smoothed waveform with the mean artifact pattern using a Spearman correlation. If sampling frequencies of the waveform and the mean pattern, interpolate the waveform to get the same number of points as the mean pattern.
- Compute the zero-crossing time : the time at which the waveform crosses 0. If there are multiples crossing time, select the first one.
- If the Spearman correlation is above 0.80 and the zero-crossing time is the interval [1.3, 1.8s], consider the event as a 50 Hz stimulation.
Note : If the signal is very noisy the detection algorithm may detect a huge number of events, in this case it may take more time to clean the detected stimulation rather than detecting manually all the stimulations
Cleaning stimulation events
Stimulation events are then sorted by increasing time and events on the same channel with the same frequency and close in time (difference inferior to 5s) are merged.